Create a Tenfold Reporting Dashboard inside Salesforce.com (SFDC)
Overview
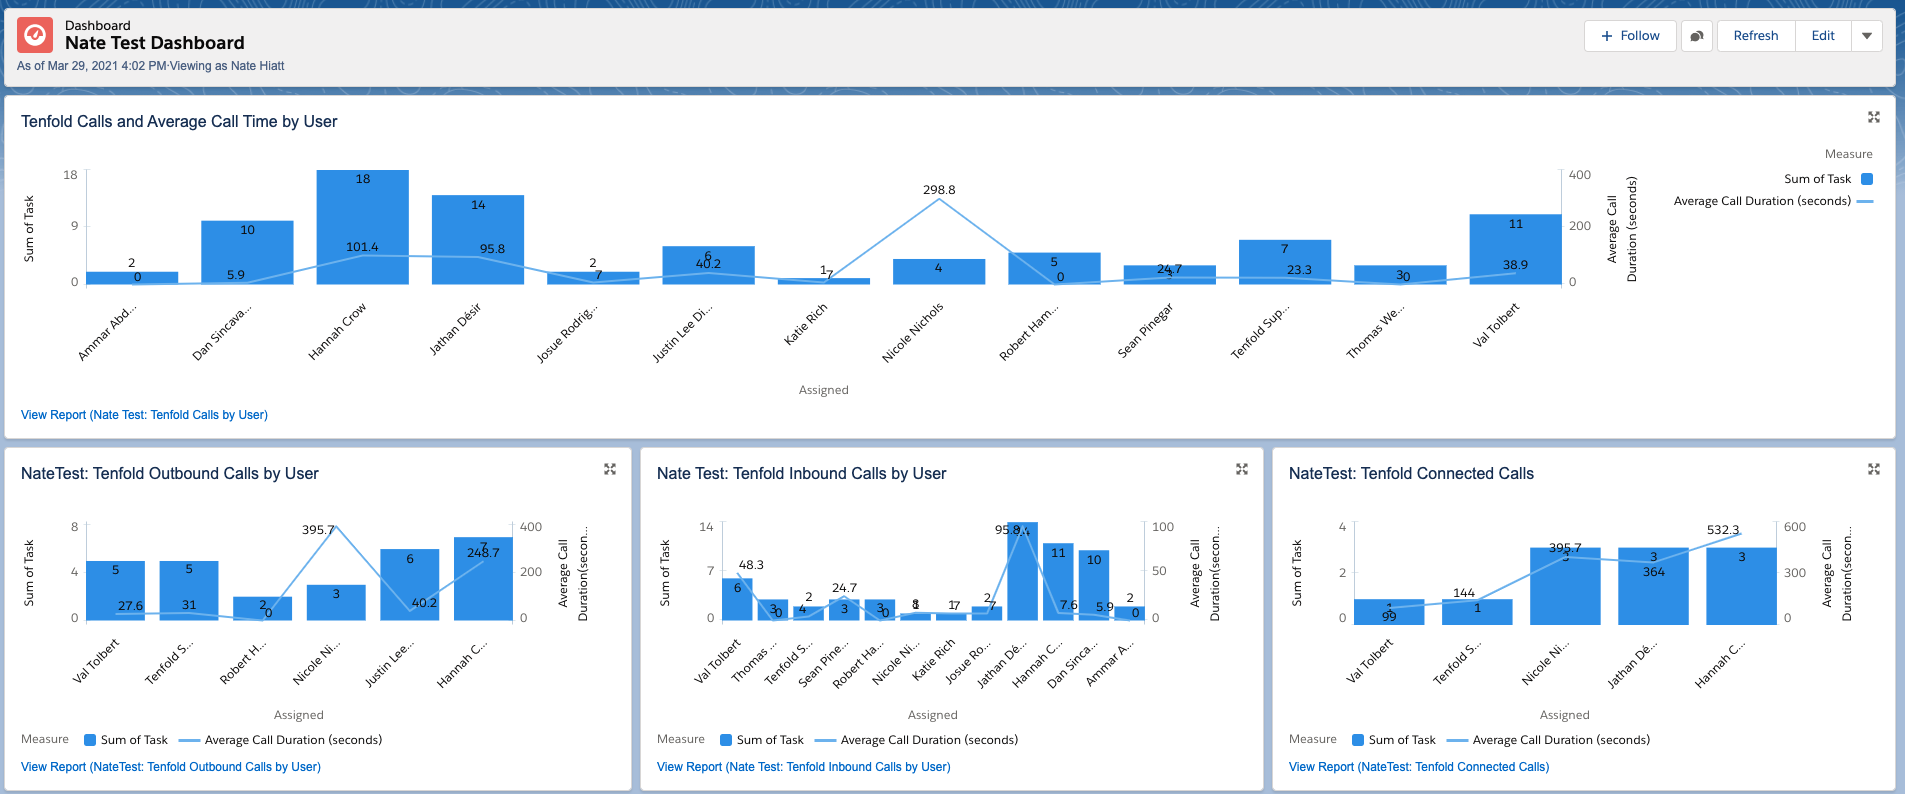
Many of the analytics available in the Tenfold Dashboard Analytics tab can be replicated within Salesforce in order to integrate your Tenfold reporting with your existing Salesforce reports/dashboards.
Tenfold pushes information such as call duration, the User who was on the call, and what time the call took place back to Salesforce via Task objects. You can utilize this data when creating reports to mimic the analytics in the Tenfold Dashboard.
In order to create a dashboard like the below image, follow the instructions in this documentation to create the individual reports. Once the reports are created, you can add them to an existing or new dashboard within Salesforce.
Prerequisites:
Access to create Salesforce Reports and Dashboards
Read access to the Task and Activity Objects
For the Tenfold Calls by Hour report: Permissions to create a custom field on the Activity Object
For the Opportunities with Tenfold Report: Create a Opportunities with Activities Report Type
Report Type: Tasks and Events
Filters:
Show Me: All Activities
Date: Your Desired Time Range
Show: Open & Completed Activities
Show: Tasks and Events
Subject: Starts with IBC, OBC
Columns:
# Call Duration - Select your preferred time unit
# Task
Any additional columns you would like to display
Group by: Assigned
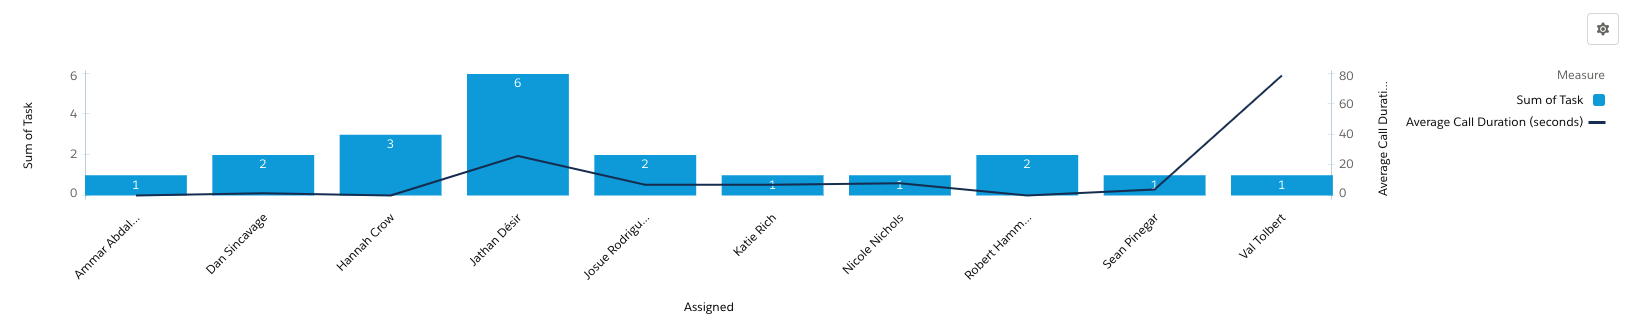
Chart Preferences:
Display As: Column
X-Axis: Assigned
Y-Axis: Sum of Task
+ Measure: Average Call Duration
Plot as Line Chart
Plot on Second Axis
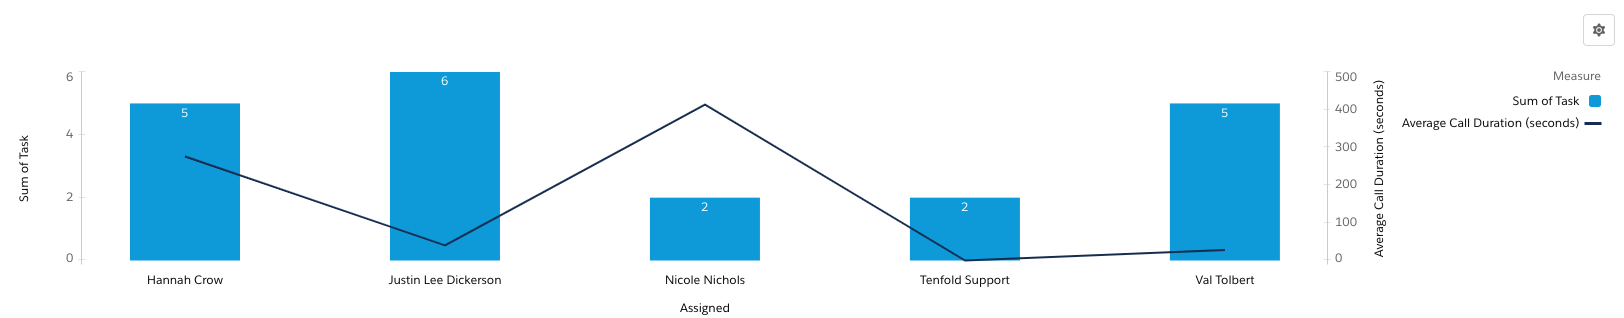
Report Type: Tasks and Events
Filters:
Show Me: All Activities
Date: Your Desired Time Range
Show: Open & Completed Activities
Show: Tasks and Events
Subject: Starts with IBC, OBC
Call Type: equals Outbound
Columns:
# Call Duration - Select your preferred time unit
# Task
Any additional columns you would like to display
Group by: Assigned
Chart Preferences:
Display As: Column
X-Axis: Assigned
Y-Axis: Sum of Task
+ Measure: Average Call Duration
Plot as Line Chart
Plot on Second Axis
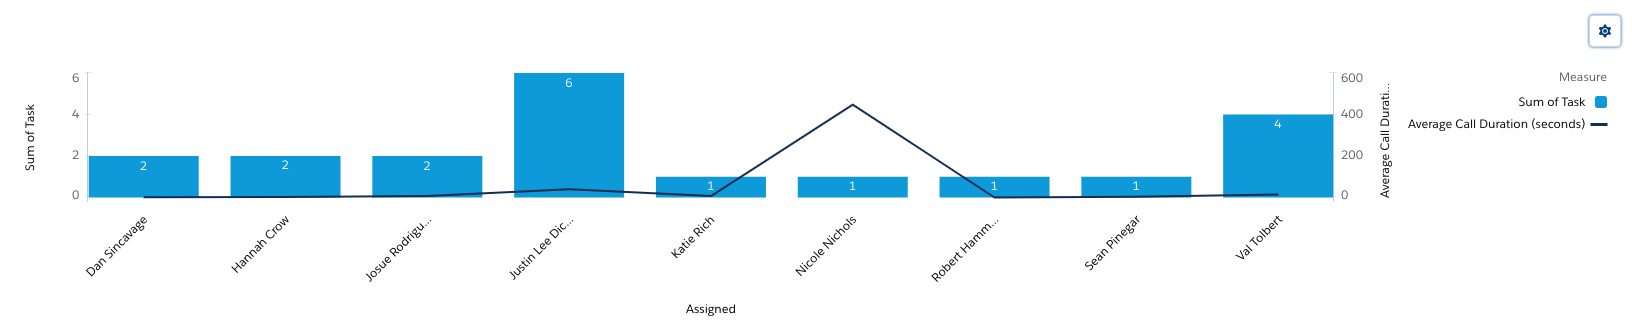
Report Type: Tasks and Events
Filters:
Show Me: All Activities
Date: Your Desired Time Range
Show: Open & Completed Activities
Show: Tasks and Events
Subject: Starts with IBC, OBC
Call Type: equals Inbound
Columns:
# Call Duration - Select your preferred time unit
# Task
Any additional columns you would like to display
Group by: Assigned
Chart Preferences:
Display As: Column
X-Axis: Assigned
Y-Axis: Sum of Task
+ Measure: Average Call Duration
Plot as Line Chart
Plot on Second Axis
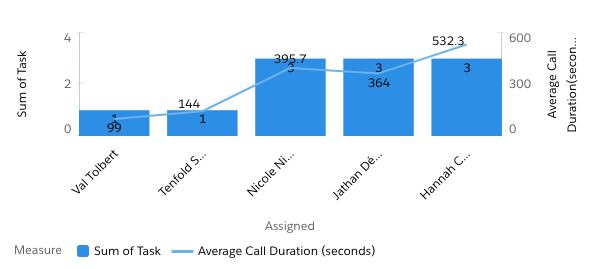
Report Type: Tasks and Events
Filters:
Show Me: All Activities
Date: Your Desired Time Range
Show: Open & Completed Activities
Show: Tasks and Events
Subject: Starts with IBC, OBC
Call Duration (seconds): Greater than 90 seconds (Change call length to match organization requirements)
Columns:
# Call Duration - Select your preferred time unit
# Task
Any additional columns you would like to display
Group by: Assigned
Chart Preferences:
Display As: Column
X-Axis: Assigned
Y-Axis: Sum of Task
+ Measure: Average Call Duration
Plot as Line Chart
Plot on Second Axis

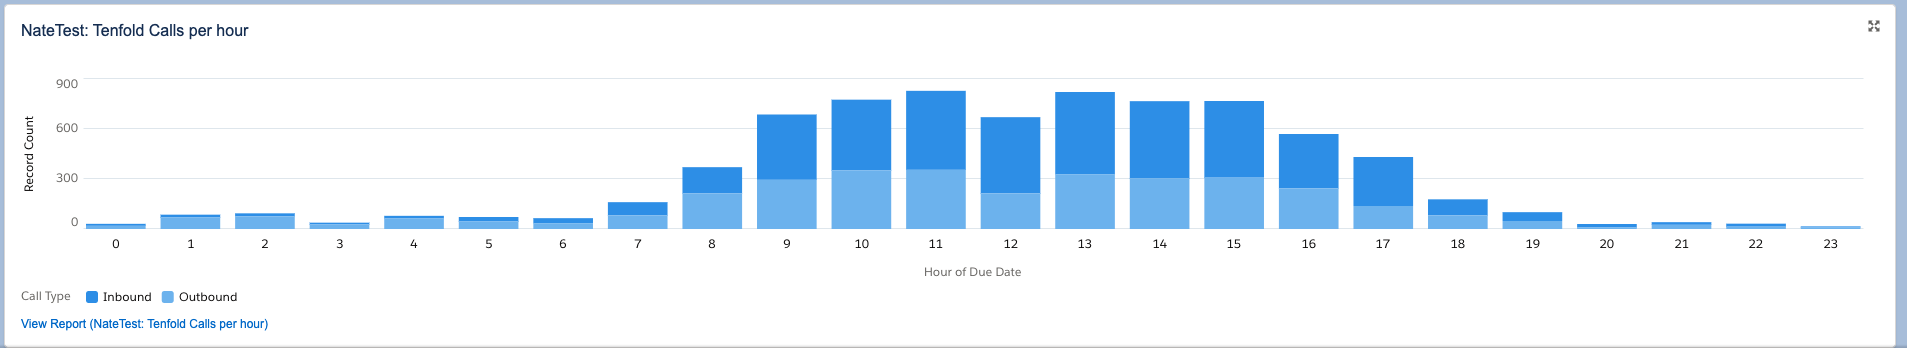
Prerequisite: Create a custom field on the Activity object in order to parse the hour information from the date field you would like to use (Ex. Due Date/Time, Created Date/Time). For this documentation, that field will be called “Hour of Due Date” which is taking the Hour value from a Due_DateTime__c field.
Create a Formula(Number) field that parses the HOUR value from the Due_DateTime__c field. Like this:
VALUE(MID (TEXT (Due_DateTime__c), 12, 2))
Keep in mind that Created and LastModified are stored in GMT, so you'll need to convert to your Local Time +/- 0.0417 for each hour
Example: VALUE(MID (TEXT (Due_DateTime__c - 0.1667), 12, 2))
Report Type: Tasks and Events
Filters:
Show Me: All Activities
Date: Your Desired Time Range
Show: Open & Completed Activities
Show: Tasks and Events
Subject: Starts with IBC, OBC
Columns:
Any additional columns you would like to display
Group by:
Hour of Due Date (See Prerequisite)
Call Type
Chart Preferences:
Display As: Stacked Column
X-Axis: Hour of Due Date
Y-Axis: Record Count
Stack By: Call Type

Prerequisite: Create a new report type for Opportunities with Activities.
Navigate to the Salesforce “Setup” menu
Use the quick find box to navigate to “Report Types”
Click “New Custom Report Type”
Primary Object: Opportunities
Report Type Label: Opportunities with Activities
Store in Category: Opportunities
Deployment Stage: Deployed
See below image for Step 2
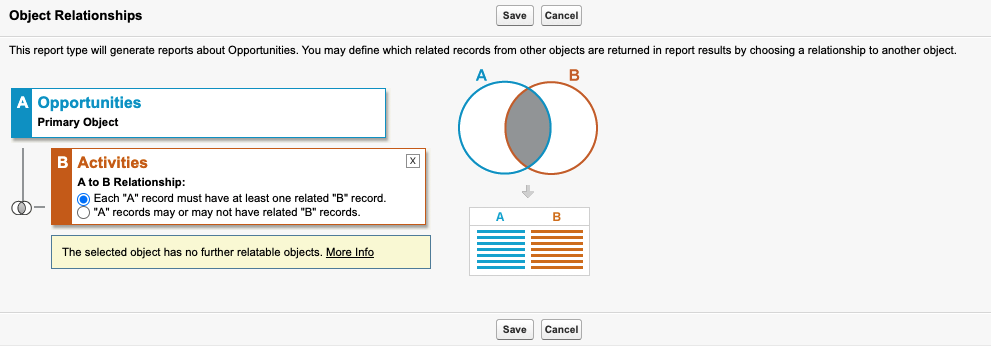
Save your new Report Type
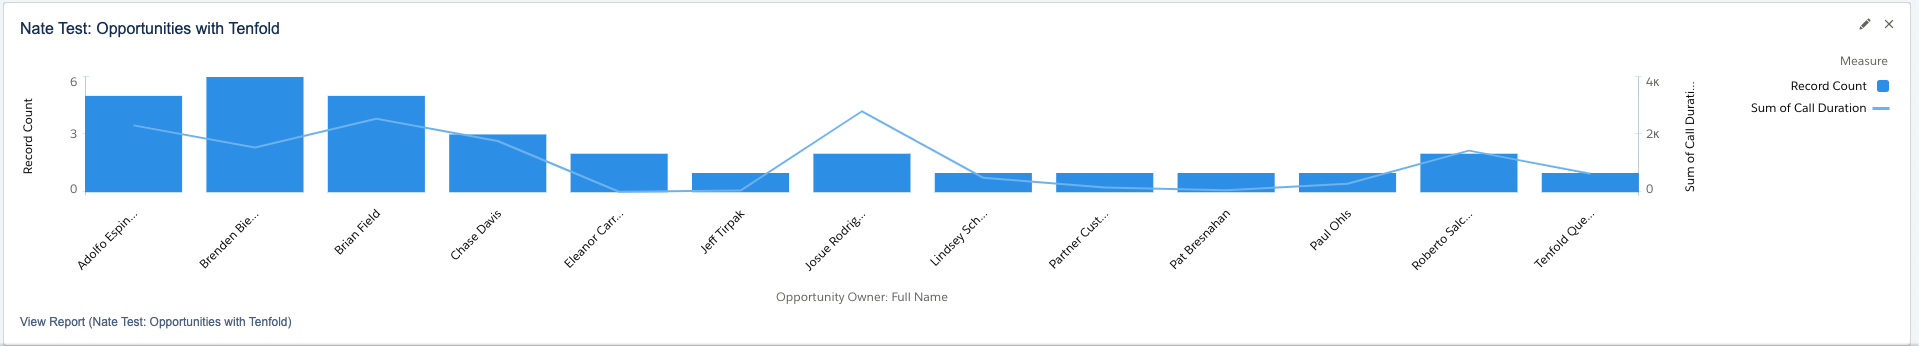
The Opportunities with Activities report type will allow you to add Tenfold activity metrics from related Tenfold calls to Opportunity reports. For this example, we added the Sum of call times to a report which is showing the number of opportunities by user. To filter to only opportunities that have an associated Tenfold task, use the filter: Task Subject: Starts with IBC, OBC.
Report Type: Opportunities with Activities
Filters:
Show Me: All Opportunities Under CEO (For full company reporting)
Created Date: Your Desired Time Range
Task Subject: Starts with IBC, OBC
Columns:
Stage
Account Name: Account Name
Opportunity Name
Task Subject
Task Duration
Group by:
Opportunity Owner: Full Name
Chart Preferences:
Display As: Column
X-Axis: Opportunity Owner: Full Name
Y-Axis: Record Count
+ Measure: Sum of Call Duration
Plot as Line Chart
Plot on Second Axis